Useful electrochemical devices often employ porous electrodes. This is because electrochemistry is by definition an interfacial phenomenon, usually happening where a liquid and a solid meet. Porous electrodes offer a high surface area, allowing a lot of reaction to be packed into a small space.

The SEM image above shows the cross-section of a Duracell AA battery, contained by a cylindrical can, with a pin at the center. The two electrodes, cathode and anode, take up most of the space inside. Both electrodes are made of particles, with liquid electrolyte filling the pores in between. A porous separator keeps the cathode and anode from touching each other and shorting.
Porous electrode theory was developed in the 1950s and 1960s to allow modeling of these kinds of electrochemical devices, and it has been successful at explaining many of the empirical facts one observes when using them. Much cutting-edge electrochemical engineering continues to rely on porous electrodes, from bioelectrochemical cells to the batteries in the Tesla Model S. Porous electrode theory is well understood, but even the most modern textbook treatments resemble journal articles in how they are structured and written. This post is an attempt to describe the theory in an accessible way. Fundamentally, the problem is a highly relevant form of transport phenomena, and should be understandable to a wider engineering audience.
A simple porous electrode model:
Ultimately a battery like the one above is part of an electrical circuit, and current must travel across the cell, from pin to can. We call the pin and can “current collectors” because they don’t participate in reactions, and are there to connect the circuit to the anode and cathode. If porous electrodes are designed well, there are ample conduction pathways through both the particle (solid) and electrolyte (liquid) phases. “Current” is the movement of charge. In solids, charge typically moves as electrons, which are negatively charged. In liquids, charge moves as ions, which may be positive or negative.
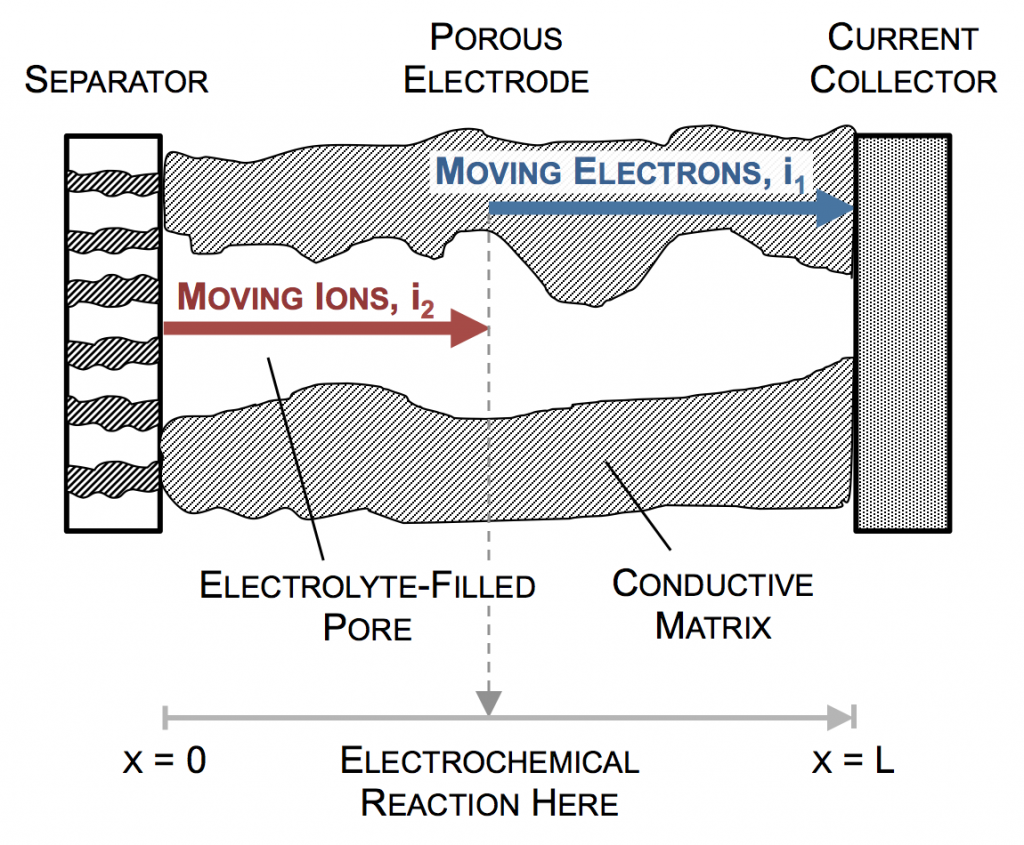
In the picture above, the complex network of pores through an electrode are described as a single pore, which extends from separator to current collector. The direction across the electrode is given by x, and we use rectangular coordinates to keep the math simple. (Thus, this is one electrode or half of the battery above, but in a rectangular configuration instead of a cylindrical one.)
The separator will not allow electrons to pass, and thus only ionic current can come through at x = 0. The current collector will not allow ions to pass, so only electrons can flow out at x = L. This is the essence of the porous electrode model: the total current flow from separator to current collector is constant: the current across the circuit, denoted as I. However, across the porous electrode it may travel either as ions or as electrons. The only necessity is that it must be all-ionic at the separator and all-electronic at the current collector.
Ionic current and electronic current may be converted to one another by an electrochemical reaction. In fact, this is the definition of electrochemistry: the study of reactions that involve both chemicals (ions) and electricity (electrons). In the picture above a unit of ionic current ends at the same location where one of electronic current begins. In reality, the ion causing the ionic current turns upward, contacts the pore wall, and there participates in the liberation of an electron. But for simplicity, we draw the entire thing as involving only motion in the x-direction.
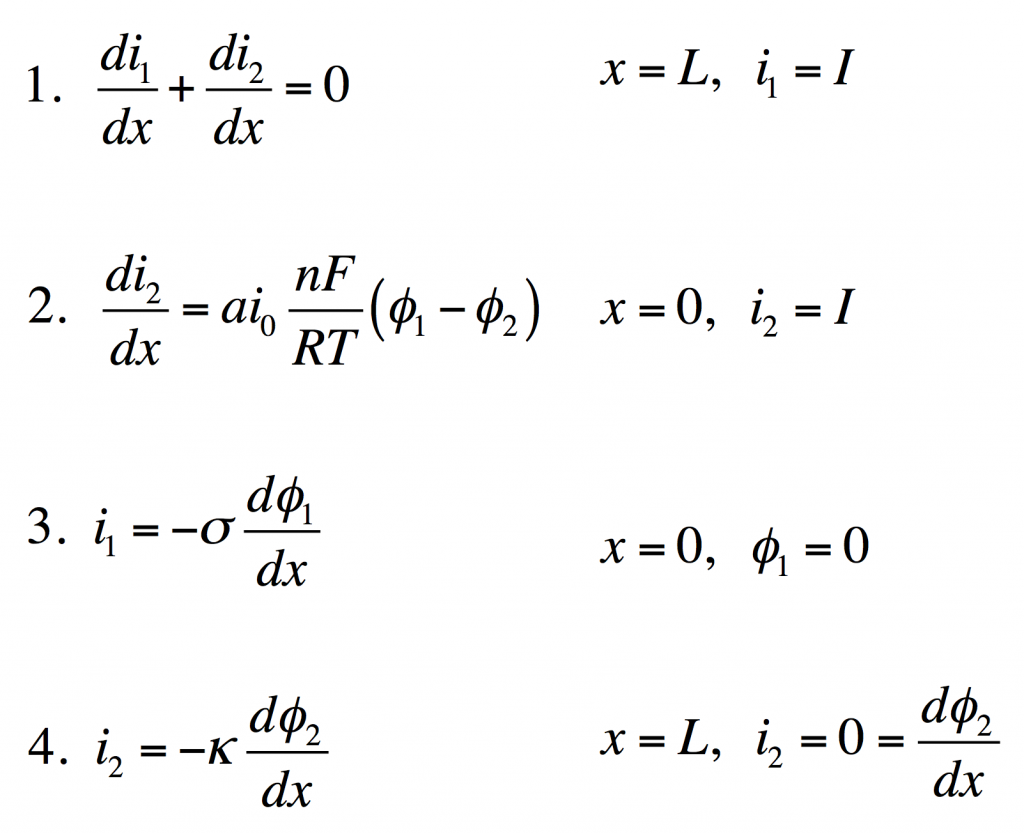
These four equations describe a steady-state porous electrode operating this way, with boundary conditions given on the right. The four unknowns are i1 and i2, the electronic and ionic currents at any x, and φ1 and φ2, the electric potentials in the solid and the liquid.
- Conservation of charge. The equation states that any i2 that disappears must be matched by appearance of i1 and vice versa. The boundary condition states all current is electronic at the current collector.
- Rate of electrochemical reaction. The equation states that i2 disappears by an interfacial reaction that is driven (linearly) by the potential difference between the solid and liquid. The boundary condition states all current is ionic at the separator.
- Ohm’s law in the solid. This relates current to potential gradient. The boundary condition arbitrarily sets the solid potential to zero at the separator.
- Ohm’s law in the liquid. The boundary condition states the liquid potential gradient is zero at the current collector.
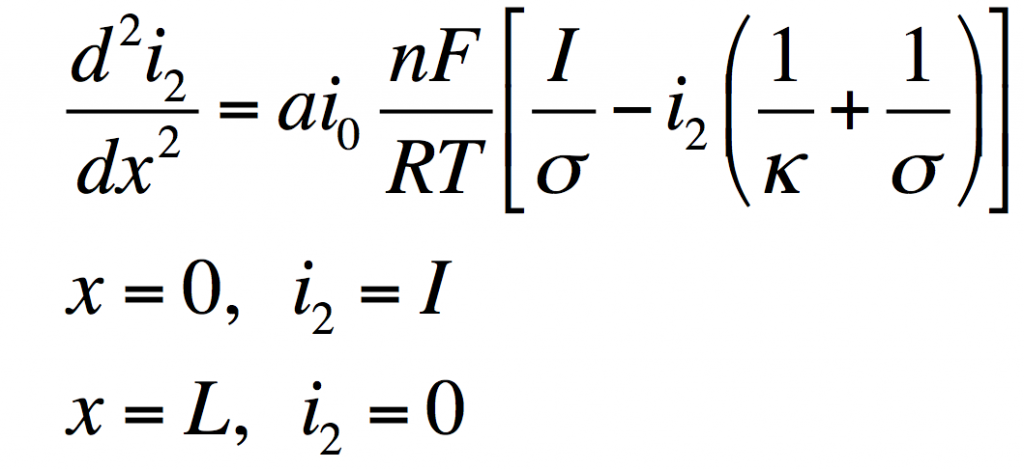
These can be manipulated into a single equation:
This has the solution:
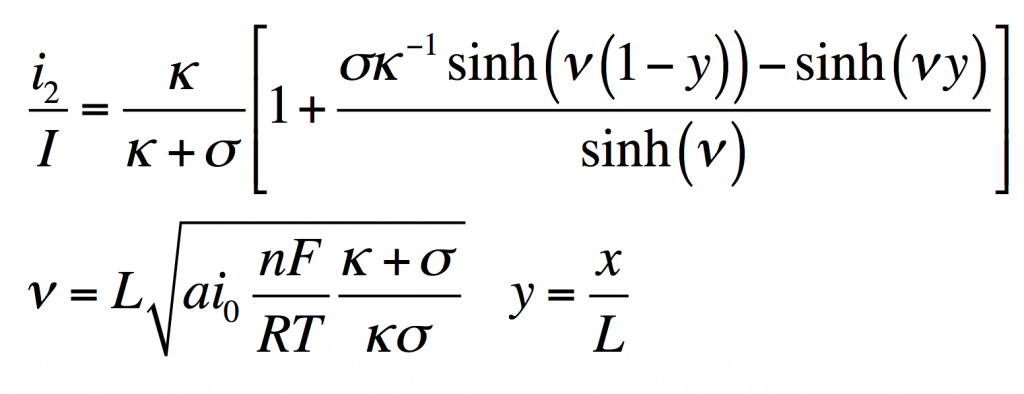
From this i1, φ1, and φ2 can be found by substitution into the original equations.
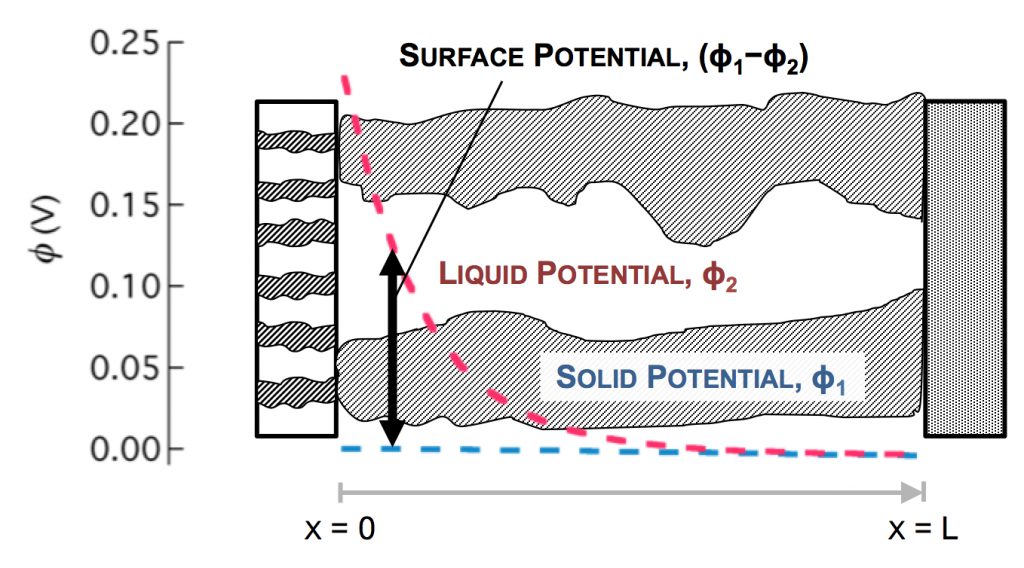
Values typical for a porous battery electrode can be used to plot the variables:
- electrode area per volume, a = 23,300 cm-1
- exchange current density, i0 = 3.5 x 10⁻⁶ A/cm2
- current density, I = 0.1 A/cm2
- length, L = 1 cm
- electrolyte conductivity, κ = 0.06 S/cm
- electrode conductivity, σ = 20 S/cm
The disparity in conductivities results in the general behavior we observe. The solid potential φ1 changes very little due to its high conductivity. However, in the liquid there is a large change in φ2 near the separator. The reaction driving force in equation 2 is the difference in these potentials, the surface potential. Thus there is substantially more reaction near the separator than elsewhere in the electrode.
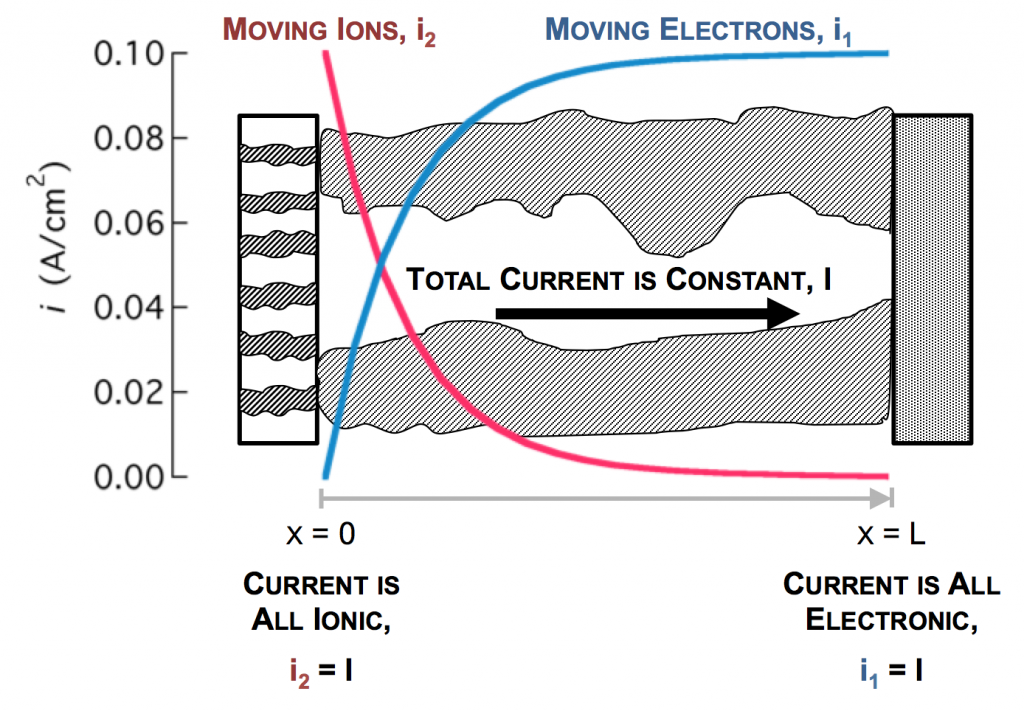
As the reaction causes conversion of i2 to i1 the current profiles change greatly near the separator. The total current is always i1 + i2 = I at any point.
Click here for Modeling porous electrodes: Part 2, which is about the difference between linear and Tafel kinetics.
Click here for Modeling porous electrodes: Part 3, which is about solving porous electrode problems using Newman’s BAND method.

