A reminder that you can follow this site via Tumblr at joshuagallaway.tumblr.com.
Author Archives: joshuagallaway
Dendrites: Zinc and Lithium
I just got back from the spring Electrochemical Society conference in Chicago, where I was presenting in a session on Dendritic Growth and Interface Stability. Several people showed in operando images of dendrites growing in real time. One in particular I liked a lot was by Layla Mehdi at PNNL … she has a specialized test cell to observe lithium dendrites by transmission electron microscopy. I’ve done a lot of work on dendrites, and what I care most about is why dendrites form. While I was watching all these great movies of dendrites growing, I wondered something I often wonder: why do some dendrites look like they grow from the tip, and some from the bottom?
Dendrites can be the result of multiple mechanisms. They’re often a mass transport effect, but sometimes not. If you flow electrolyte over dendrites, you can directly observe the kinetic growth limit at their tips (plug for my paper about about that), but the non-growing locations aren’t really mass-transport starved … rather, they are in locations of low overpotential. So, that all makes sense, but still sometimes I’m baffled. Consider the two movies below …
The first one (this is my data from the paper above btw) shows zinc dendrites growing in a 1 mm wide flow channel, with alkaline electrolyte flowing from top to bottom. Essentially this is a model of a zinc flow battery. Growth here is potentiostatic (2.5 V) with oxygen generation at the electrode on the right. The important thing is watch the tips. That’s where the growth is. The bases of the dendrites are static.
Here is an analogous movie of a lithium dendrite growing in a flow channel. This was taken by Owen Crowther (paper here), who’s now working at Eagle Picher. If you focus on the dendrite tip, it doesn’t look like there’s any action there. Growth seems to come from the base (or middle). But that would be the location of lowest overpotential and lowest mass transport, so there must be something catalytic happening. Perhaps it’s because of a locally thin SEI layer.
Dimensional analysis of batteries
Now that high performance batteries are a big part of our daily lives, powering our cell phones and portable computers, we naturally want to spend less time waiting for batteries to charge up. This has prompted the search for ultrafast batteries. We would like batteries that can cycle at high currents, either discharging or charging in no time. Perhaps you’d like to charge your cell phone in under a minute, or you’d like to charge your EV in the same few minutes it takes to fill up with gasoline.
Either way, fast batteries are an engineering challenge. A good way to think of this is that it’s fairly easy to make a small battery that can cycle rapidly, but as a battery becomes larger, approaching the size it takes to power your phone or car, it gets more challenging. The way to understand this is to look at dimensional analysis.
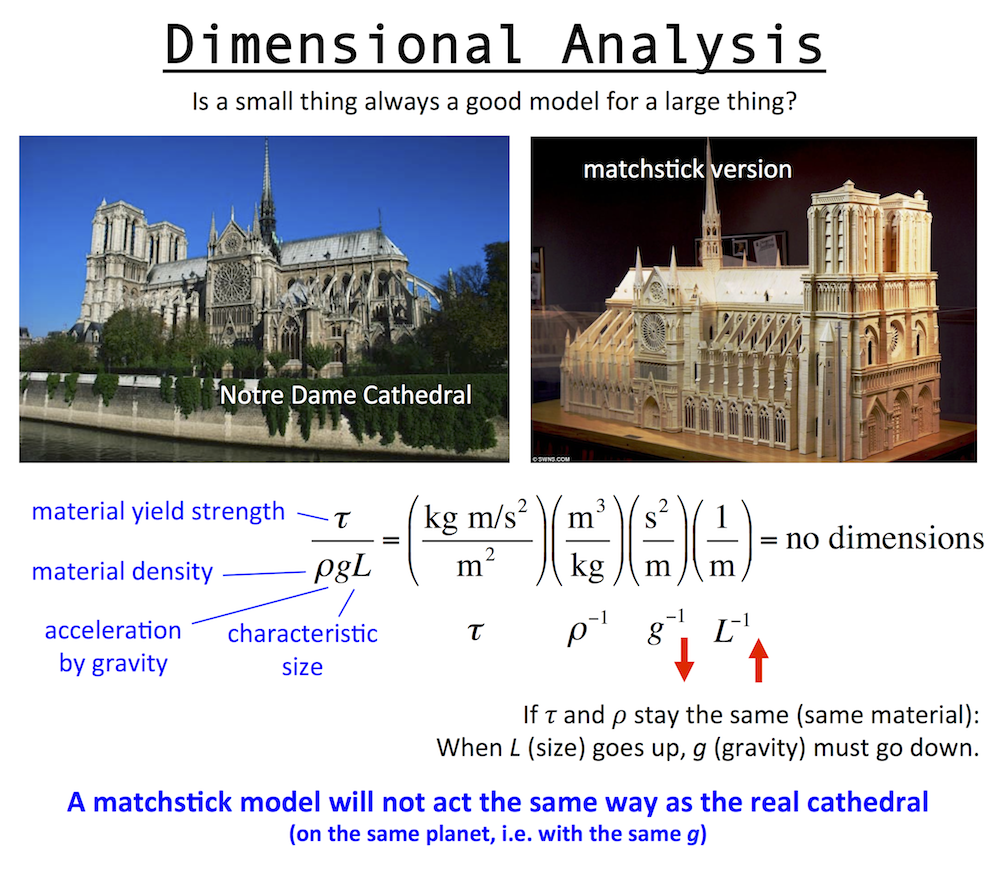
Dimensional analysis is the engineering concept used to understand the scale or size of something, and was discovered by Galileo. Basically, to make size not matter, you have to eliminate all dimensionality in a problem. To do this you multiply/divide the important constants in the problem to make the dimensions cancel out.
Up above is a dimensionless number for a structure, which involves: the yield strength and density of the structure materials, the gravitational constant (gravity pulls down on the structure), and the structure size, which is L, a length like the height. Consider this: is a matchstick model of Notre Dame Cathedral a fair model of the real Notre Dame cathedral? And if so, does it mean you could make the real Cathedral out of wood too?
The answer is no. The matchstick model is not at all like the real Cathedral, because while size does change between the two, gravity does not. A successful matchstick model means you could build the real Cathedral out of wood … only on a smaller planet with a lower value of g.
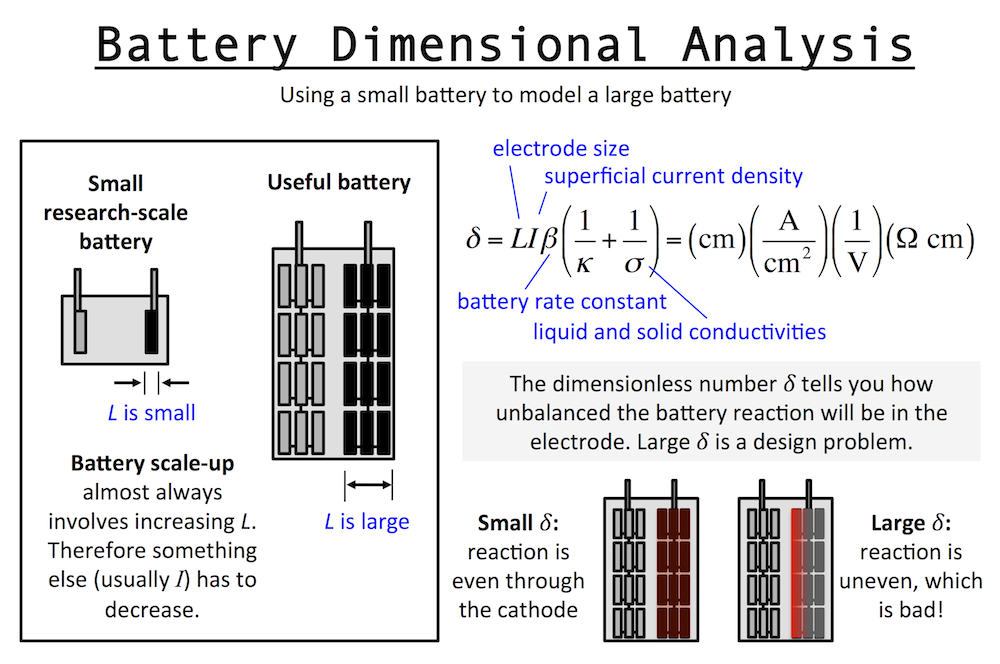
Dimensional analysis of a battery is similar to that of the Cathedral above. Imagine a small research-scale battery you might work with in a lab, and then imagine a practical battery based on it. The practical battery has been developed and scaled-up to provide the power and energy required by the application. Scaling up a battery almost always involves thickening the electrodes, and we will call this “increasing L.” The important length scale of an electrode is usually the thickness in the same dimension as current flow.
I’ve written previously about reaction rate distributions in battery electrodes (here and here). The dimensionless number δ (or John Newman’s number) tells you how balanced the reactions in a battery electrode are. When L increases, it tells you that something else has to decrease, like current I, if you want to keep δ the same. This means in general a small battery will charge fast and a large battery will charge slowly.
This is unless the other parameters in δ change accordingly to keep behavior the same … for example the porosity could be increased and that would increase the pore conductivity or κ and therefore decrease δ. But usually this goes in the opposite direction: as you scale up typically you want to achieve higher active material loading, pushing you to decrease porosity and thus decrease κ and increase δ. In fact, almost every decision you make during scale-up forces you to increase δ overall.
For this reason, the very first research decision you should try to make is to set L at the same value in your small battery that you will need in the final device. That way it becomes easier to understand scale-up, and you can extrapolate research results to real-world situations. When analyzing a fast battery, first check L and see whether scale-up will require it to increase.
Developing a market for grid-level batteries
The “smart grid” vision will reduce energy waste and increase flexibility in power generation, transmission, and distribution. The resulting increase in efficiency will reduce the amount of carbon released into the environment due to power generation. One piece of this vision is grid-integrated electrical storage, such as batteries incorporated into the grid on a large scale. This will require extremely low cost, extremely safe, high energy density batteries. No currently well-established battery technology satisfies these needs perfectly.
This raises the question, if you can develop such a battery, what is the initial market? Even though the concept of the the smart grid is well-accepted and people talk about it a lot, were you to unveil the perfect battery tomorrow, who would buy it? And what for? The current grid has to evolve into the smart grid, so you have to look for the piece that can or will change first. And since the driving force for this evolution is economic, where can batteries allow the buyer to benefit financially? One answer is to solve a problem for the electrical utilities, such as allowing their current infrastructure to keep up with growing electricity demand. The technical name for this is T&D upgrade deferral. (T&D stands for transmission and distribution.)
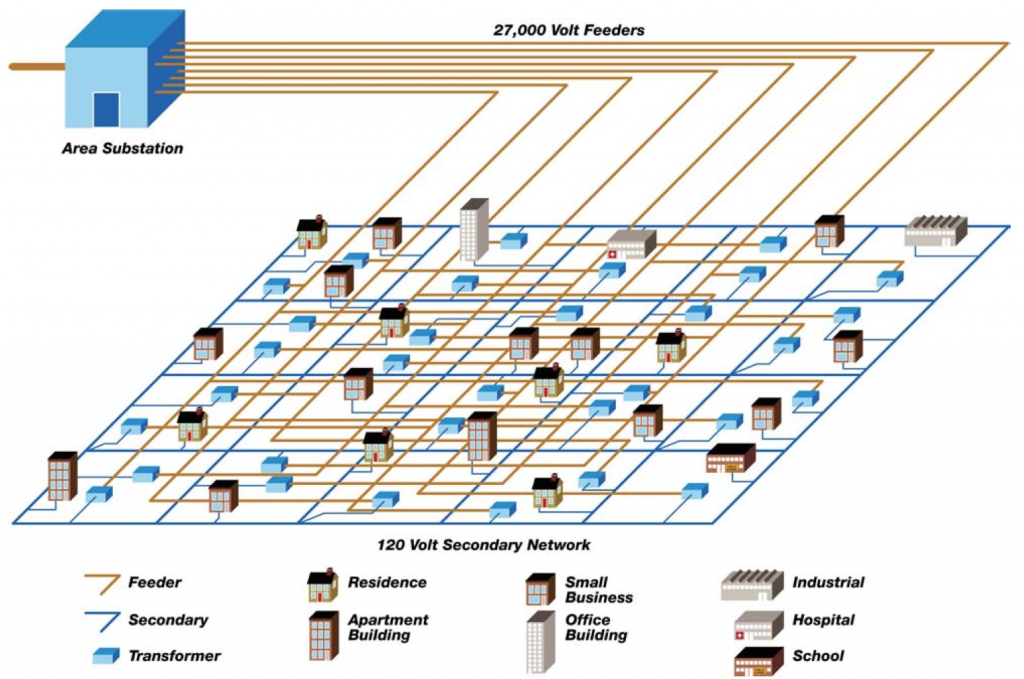
A 27,000 V substation primary network feeding a 120 V secondary network
As an example of how electricity gets from the utility to the customers, I’ll look at Astoria, New York, where I live. A typical area substation supplies 27,000 V electricity to a 120 V secondary network which connects to the consumers (illustration from Con Edison shown above). There are 7 networks of this kind in Queens county. In one, the North Queens substation provides electricity to the Long Island City network (shown below), which includes Astoria. The North Queens substation is capable of supplying a peak 483 MW of electricity. In 2006 the forecast peak demand for this network was 300 MW for commercial customers and 100 MW for residential customers (so 400 MW total). This is well under the substation’s capability (83%), but 2006 was a long time ago, and as the population grows and people use more power, there will come a time when a new substation will be required to meet the peak electrical demand. (Specifically this is when at any given time the customers served require more than 483 MW of electricity.)
Long Island City network in Queens NY
However, by incorporating battery storage into a substation such as this, the peak demand forecast could be above the maximum output of the substation, thus deferring the need to build a new substation. At any time the peak demand rose above 483 MW, integrated batteries would make up the difference between what the substation equipment could provide and what customers required. The size of the battery would determine how large of a demand peak you could satisfy.
In fact, utilities have expressed a desire for a battery solution for this kind of T&D upgrade deferral. Rising electrical demand in the five boroughs is resulting in the need for new electrical infrastructure. Many new substations have been constructed in recent years at a cost $200-400 million per substation. This includes York substation (Upper East Side), Academy substation (Upper Manhattan), Newtown substation (Brooklyn-Queens border) and Mott Haven substation (the Bronx, shown below). Con Edison has announced that if an alternative way to shave peak demand is not found, a $1.1 billion dollar expansion will be required for Brooklyn and Queens by 2019. Using battery storage has the potential to slow the need of new construction.
A battery system would be modular and portable as any particular deferral project would be temporary, after which time the storage could be relocated for a new project. Multiple batteries based on standard shipping containers could provide on the order of 40 MWh of storage to help meet peak demands. At a cost of $100/kWh, such a system would cost $4 million, far less than the cost of a new substation. This use of batteries would be temporary, but would allow the utility tremendous flexibility in choosing when and where to upgrade equipment.
The Mott Haven substation in the Bronx, disguised with brickwork and fake windows (image courtesy The New York Times)


